
Appearance
Memory Management
The unified memory model
Since Spark 1.6, the UnifiedMemoryManager has replaced the earlier static split between execution and storage memory with a single shared region, referred to as M[1][2]. M is carved out of the JVM heap after first setting aside 300 MiB of reserved system memory: M = (JVM heap − 300 MiB) × spark.memory.fraction, with spark.memory.fraction defaulting to 0.6[2:1][3]. Within M, spark.memory.storageFraction (default 0.5) marks off a subregion reserved for cached blocks that are immune to eviction; with defaults, this works out to roughly a 30%/30% on-heap split between execution and storage out of total executor memory[3:1].
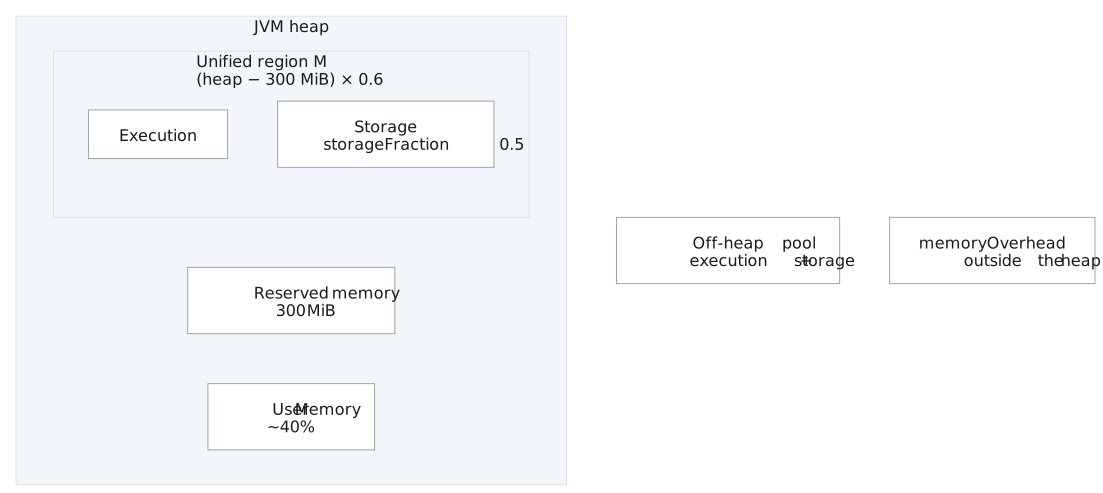
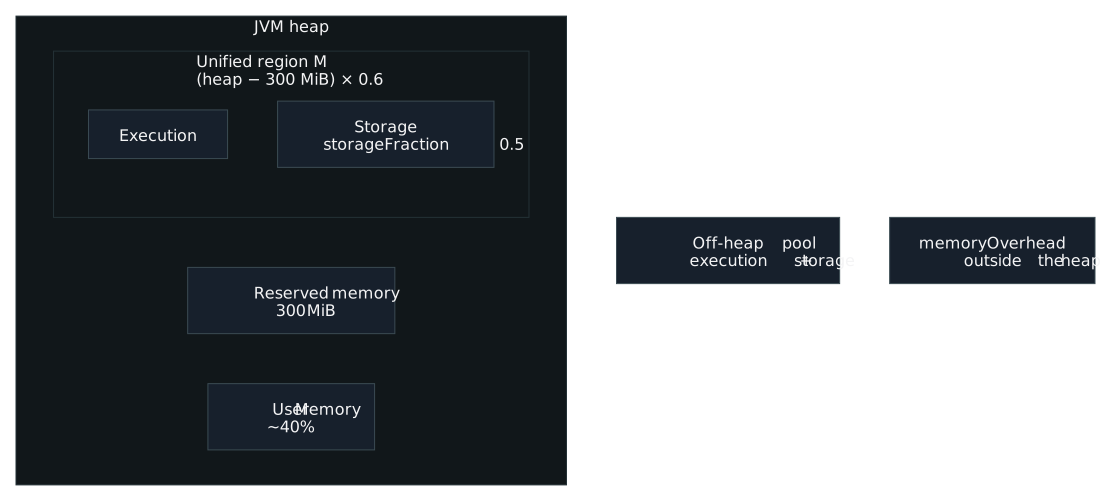
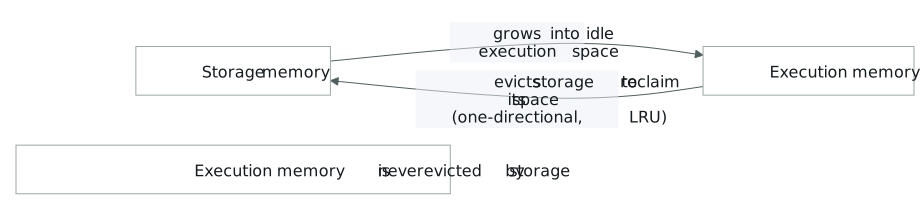
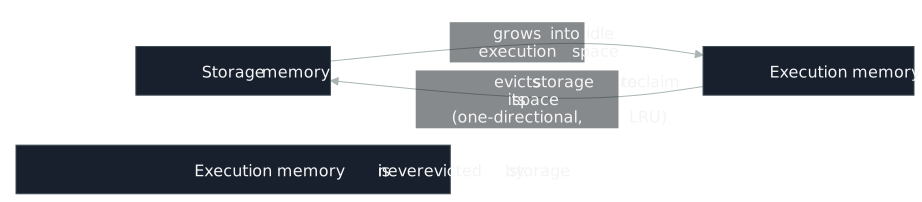
Execution and storage borrow from each other dynamically rather than sitting behind a hard wall: when execution memory is unused, storage can acquire all of it, and vice versa[2:2][1:1]. The two are not equal peers, though. Execution always has priority, taking memory immediately and evicting cached storage blocks if necessary[3:2].
The reserved 300 MB is a flat constant (RESERVED_SYSTEM_MEMORY_BYTES in the Spark source), not a formula, and it's hardcoded: there is no supported production configuration to change it. The only override is the internal spark.testing.reservedMemory property, which exists for Spark's own test suite rather than production tuning[3:3]. spark.memory.fraction is applied against heap minus that reserved 300 MB, not against total heap. The tuning guide is explicit that it "expresses the size of M as a fraction of the (JVM heap space − 300MiB)"[2:3].
Off-heap memory extends the same model outside the JVM heap. When spark.memory.offHeap.enabled=true, Spark allocates raw off-heap buffers via sun.misc.Unsafe (routed through jdk.internal.misc.Unsafe on JDK 17+, which is why some builds need --add-opens flags), and that off-heap region is split into its own execution and storage pools, following the same borrowing rules as on-heap memory: execution has priority, storage gets evicted first[3:4]. Enabling it requires spark.memory.offHeap.size to be set to a positive value; leaving it enabled with the default size of 0 is a documented-invalid combination, not a supported way to run with off-heap "on but empty"[4]. The setting also "has no impact on heap memory usage". Turning on off-heap memory does not shrink the JVM -Xmx for you, so the on-heap size has to be reduced manually to keep total footprint constant[4:1]. This off-heap execution memory underlies Project Tungsten: its compact binary row encoding, its explicit-memory-managed hash map for aggregations, and its cache-aware sort/join algorithms are all built to run against off-heap, GC-invisible memory[5][6].
Executor memory overhead is a separate pool layered on top of M. spark.executor.memoryOverhead defaults to executorMemory × spark.executor.memoryOverheadFactor, floored at spark.executor.minMemoryOverhead (384 MiB)[4:2]. spark.executor.memoryOverheadFactor itself defaults to 0.10 for ordinary JVM executors, but Spark bumps that default to 0.40 specifically for Kubernetes non-JVM jobs, since those workloads tend to need more non-JVM heap space[4:3]. The legacy, YARN-only spark.yarn.executor.memoryOverhead property was removed in Spark 3.0 in favor of the cluster-manager-agnostic spark.executor.memoryOverhead[3:5].
PySpark:
spark.python.worker.memory(default512m) is a soft spill threshold for a Python worker's own aggregation buffering, not a JVM-enforced cap. A PySpark worker runs as a separate OS process outside the JVM heap, so the JVM cannot police it directly[3:6]. The only setting that actually tries to bound PySpark memory per executor isspark.executor.pyspark.memory, and even that depends on Python'sresourcemodule, which isn't supported on Windows and doesn't actually limit anything on macOS[4:4]. Left unset, PySpark memory usage is folded intospark.executor.memoryOverheadby default[4:5].
Watching eviction and spill
That borrowing leaves a trace once eviction actually happens. Storage eviction under memory pressure follows an LRU (least recently used) policy[1:2][7]. The granularity is the block: the BlockManager tracks cached data as per-partition blocks (one block per RDD/DataFrame partition) and LRU operates at that level rather than evicting an entire RDD or cached table in one shot[8][9]. In practice this tends to evict the oldest partitions first, those materialized in the earliest job or stage, though lazy evaluation makes it hard to predict exactly which partitions will go ahead of time[9:1].
What happens to an evicted block is visible in its downstream effect and depends on its StorageLevel. For MEMORY_ONLY, the block is simply dropped and recomputed from the RDD's lineage the next time it's needed. For a disk-backed level like MEMORY_AND_DISK, the evicted block is written to disk and read back from there instead of being recomputed[9:2][7:1]. Blocks can also be evicted well before you ever try to reuse them: .cache() does not guarantee a block stays resident, especially on busy clusters or long pipelines[7:2].
On the execution side, each task gets its own TaskMemoryManager, which enforces a soft per-task cap: with n tasks running concurrently, each task is allowed to allocate somewhere between 1/(2n) and 1/n of total execution memory, and the first task to arrive on an idle executor typically grabs more than its later-arriving neighbors[3:7].
When a sort or hash-aggregation operator keeps requesting execution-memory pages and can't get more, Spark doesn't fail immediately. It blocks the requesting task, spills that task's in-memory data structure to disk, or, in the worst case, throws an OutOfMemoryError[3:8]. The spill path runs through Spark's map/shuffle I/O machinery: shuffle partitions created by wide transformations like groupBy() or join() spill to the executors' local disks at the location set by spark.local.directory[6:1]. SQL physical operators apply the same idea with their own row-count guardrails: sortMergeJoinExec's in-memory buffer and the cartesian-product operator's buffer both spill once they cross a configured row threshold, which by default is set to the value of spark.shuffle.spill.numElementsForceSpillThreshold[10].
Whatever the trigger, the resulting spilled bytes are exposed on the task metrics as memoryBytesSpilled, visible in the Spark UI and event log. This is the concrete signal to watch for execution memory pressure[11].
Memory-overhead misconfiguration shows up differently: it manifests as the container or pod being OOMKilled with a vague container-memory error rather than a Spark-level exception, since the enforcement happens at the YARN NodeManager or Kubernetes kubelet/cgroup layer, not inside the JVM[3:9]. Under the old default overhead factor of 0.10, non-JVM Kubernetes jobs commonly failed with "Memory Overhead Exceeded" errors, which is exactly why Spark bumped the Kubernetes non-JVM default to 0.40[4:6].
What the borrowing costs you
None of this is free for whoever's counting on cached data staying put. Because execution always wins the tug-of-war over storage, caching is never a guarantee; it's a best effort. As luminousmen-memory-management puts it: "If Execution needs memory, it takes it. If Storage is using that space (cached RDDs, broadcasts), Spark starts evicting blocks. If Execution is idle, Storage can grow into that space, until Execution comes back."[3:10] That growth-then-shrink-back behavior is dynamic borrowing, not storage evicting execution; eviction is strictly one-directional. As spark-notes-task-memory-management summarizes the agreement between the two regions: "keep acquiring execution memory and evict storage as you need more execution memory"[1:3], never the reverse. The same asymmetric rule carries over when off-heap memory is enabled: execution still has priority and storage still gets evicted first[3:11]. Practically, this means a cached DataFrame can silently lose blocks under memory pressure, forcing an expensive lineage recompute (for MEMORY_ONLY) or an extra disk round-trip (for MEMORY_AND_DISK) the next time it's touched.
The TaskMemoryManager's soft per-task cap explains why spill behavior is workload-shape-dependent rather than a fixed threshold: with more tasks packed onto an executor, each one's guaranteed share of execution memory shrinks toward 1/(2n), making spills more likely under high task concurrency even when total execution memory hasn't changed[3:12].
Off-heap memory's payoff is specifically about garbage collection: because off-heap buffers sit outside the JVM heap, they are invisible to the garbage collector, so fewer and smaller live objects need to be tracked, scanned, and copied, which reduces both the frequency and duration of GC pauses[3:13]. Project Tungsten's off-heap hash map for aggregations was benchmarked at over 1 million operations per second in a single thread, with "almost no performance degradation as memory utilization increases," unlike the JVM default java.util.HashMap, which eventually thrashes on GC[5:1][6:2]. The tradeoff is that off-heap memory removes the GC safety net along with the GC overhead: there's no garbage collector cleaning up if something goes wrong[3:14].
Memory overhead matters because off-heap memory and (if unset) PySpark memory are not automatically folded into the overhead calculation the way heap memory is. Enabling spark.memory.offHeap.size without also raising spark.executor.memoryOverhead (or explicitly setting spark.executor.pyspark.memory) can push the executor's real footprint past what the cluster manager granted, and the process gets killed with a vague container-memory error instead of a Spark-level exception[3:15]. Worked example: with --executor-memory=8G, the default 10% overhead gives max(0.1 × 8192 MB, 384 MB) = 819 MB, so the total memory requested from the cluster manager is 8192 + 819 = 9011 MB[3:16], useful to keep in mind when sizing containers or pods against a cluster's available capacity.
Tuning the memory pools
Most of this is adjustable, within limits. Tune spark.memory.fraction and spark.memory.storageFraction only if your workload's execution/storage balance genuinely needs to shift away from the ~30/30 default. But don't try to reclaim the 300 MB reserved region; it's a fixed, non-tunable constant in production[3:17].
If losing cached partitions to eviction is costly, prefer a disk-backed StorageLevel such as MEMORY_AND_DISK over MEMORY_ONLY: an evicted block gets written to disk and read back rather than triggering a full lineage recompute[9:3][7:3]. Keep in mind .cache() alone is not a residency guarantee even with this choice[7:4].
Watch memoryBytesSpilled in the Spark UI or history server to catch execution-memory pressure early[11:1]. If sort or hash-aggregation spills are heavy, consider giving the executor more memory or reducing the number of concurrently running tasks per executor, since the TaskMemoryManager's per-task guarantee shrinks as task concurrency n grows[3:18]. For SQL joins and cartesian products, spark.shuffle.spill.numElementsForceSpillThreshold governs when sortMergeJoinExec and the cartesian-product operator spill their buffers[10:1].
Set spark.executor.memoryOverhead explicitly rather than relying on the default, especially on Kubernetes for non-JVM workloads (where the default factor is already bumped to 0.40) or whenever off-heap memory or heavy PySpark usage is in play: those aren't automatically folded into the overhead calculation, so an unadjusted overhead can lead to an OOMKilled container instead of a clean Spark-level error[3:19][4:7]. Use spark.executor.memoryOverhead, not the removed spark.yarn.executor.memoryOverhead[3:20]. For capacity planning, remember the total requested from the cluster manager is executor memory plus overhead, e.g., 8192 + 819 = 9011 MB for an 8 GB executor at the default 10% factor[3:21].
When enabling off-heap memory, always pair spark.memory.offHeap.enabled=true with an explicit positive spark.memory.offHeap.size (never leave it enabled at the default size of 0[4:8]) and manually reduce the JVM -Xmx to compensate, since enabling off-heap memory does not shrink the heap for you[4:9].
PySpark: if you need PySpark's own memory bounded rather than folded silently into the overhead, set
spark.executor.pyspark.memoryexplicitly, though its enforcement relies on Python'sresourcemodule and won't work on Windows and won't actually limit anything on macOS[4:10].
Cache utilization
CSTOR
Spark's event log carries no block-access or hit-rate events, so cache utilization is read from periodic per-RDD storage snapshots instead: how much of a persisted RDD is actually resident where it was asked to be.
How it's detected
A persisted RDD, one whose storage level requests memory and/or disk with at least one partition actually cached, is evaluated on two independent measures and can register on both at once:
| Signal | Info | Warning |
|---|---|---|
| Cached ratio (cached partitions ÷ total partitions) | < 90% | < 50% |
Disk ratio (disk bytes ÷ (memory bytes + disk bytes)), MEMORY_AND_DISK* levels only | > 15% | > 40% |
Both ratios come from a point-in-time storage snapshot taken at stage-submission events, not a runtime block-access count, so confirm against the Spark UI's Storage tab before acting. Confidence scales with the RDD's partition count: below 10 partitions the ratio is noisy enough to call low confidence, at 50 or more it's high.
Why it matters
A partially cached RDD still pays the recomputation cost for its evicted share on every later read, undercutting the reason it was cached in the first place. Disk spillover under a MEMORY_AND_DISK* level keeps that data around instead of forcing a recompute, but a disk read is still far slower than serving it out of memory.
How to fix it
- Increase executor memory, or reduce the size of the dataset being cached, so more of it fits in the storage region without eviction.
- If the RDD is only cached for the occasional narrow scan, weigh whether persisting it at all is worth the partial-cache overhead, versus recomputing the slice you actually need.