
Appearance
Executor Utilization
UTIL
What it is
Executor utilization measures how much of the cluster's allocated core-time a job actually keeps busy. When busy core-time trails the core-time available across the run, the cluster is holding compute (cores and memory) that isn't running any tasks.
How it's detected
The signal is the ratio of busy executor core-time to the core-time available over the run: peak concurrent cores multiplied by the app's duration.
| Signal | Fires when |
|---|---|
| busy core-time / available core-time | < 60% |
A finding here always reports at the info level.
Why it matters
Idle executors are allocation you're paying for without getting work done. One common cause is too little task parallelism to occupy the allocated cores: the guidance is to keep at least as many partitions as there are cores across the executors, so no core sits idle[1]. Parallelism can also be lost by accident rather than by under-partitioning upfront: because coalesce is a narrow transformation, reducing partition count with it forces the entire upstream stage down to the reduced parallelism, not just the coalesce step, trading a shuffle for lost concurrency[2]. Separately, under dynamic allocation, a workload with many small tasks can end up over-provisioned: by default it requests enough executors to maximize parallelism for the task count, and with small tasks that can mean some executors "might not even do any work," wasting resources on allocation overhead[3].
How to fix it
- Reach for
repartition(notcoalesce) when you need to raise partition count or rebalance data:coalesceonly avoids a shuffle when shrinking partition count, and doing so also drags the entire upstream stage down to the reduced parallelism[4][2:1]. - Size partitions so the task count is at least the core count available across executors, to avoid leaving cores idle[1:1].
- Under dynamic allocation, lower
spark.dynamicAllocation.executorAllocationRatiobelow its default of1.0to scale back the number of executors requested for workloads made up of many small tasks[3:1]. - Dynamic allocation requires shuffle tracking, the external shuffle service, or shuffle-block decommissioning to be enabled as a precondition[3:2]; without one of them, an executor removed mid-shuffle takes its unfetched shuffle files with it, forcing a recompute[5], which undercuts using dynamic allocation to shed idle executors in the first place.
spark.dynamicAllocation.shuffleTracking.enableddefaults totruesince Spark 3.0, satisfying that precondition without needing a separate external shuffle service[3:3].
Restore parallelism after a heavy filter, and rein in over-provisioning for many-small-task jobs:
python
# repartition (not coalesce) rebalances and can raise partition count; aim >= total executor cores
df = df.filter(heavy_predicate).repartition(spark.sparkContext.defaultParallelism)

# Scale back executors requested for many-small-task workloads (default ratio 1.0)
spark.conf.set("spark.dynamicAllocation.executorAllocationRatio", "0.5")  # 0.5 is an example
Limitations / false-positive risk
A low average-to-peak ratio isn't always waste. A bursty or I/O-bound job legitimately holds executors while tasks wait on external systems rather than burning cores, and the ratio is sensitive to short stages, where a brief spike in allocation skews the average without meaning the cluster was genuinely idle.
Core locality
LOCAL
Idle cores are one half of wasted capacity; this is the other half. A core running a task without process- or node-local data placement is still busy, but that task now has to fetch its input across the network or from a different process instead of reading it in place, work the core wouldn't have to do at all if it were scheduled on data it already holds.
How it's detected
The share of tasks that ran RACK_LOCAL or ANY, out of every task with a recorded locality level, is the non-local task share. NO_PREF tasks stay in the denominator only, since shuffle-read stages legitimately report that level without it indicating a placement problem. This applies once a run has logged at least 50 total tasks.
| Signal | Warning | Critical |
|---|---|---|
| Non-local task share | ≥ 15% | ≥ 35% |
Why it matters
A task denied process- or node-local placement pulls its input over the network or through inter-process I/O instead of reading it from local memory or disk, adding latency to every task that lands that way. Spread across a whole run, a high non-local share adds up to a meaningful share of total task time spent moving data that a better-placed schedule wouldn't have had to move.
How to fix it
- Check
spark.locality.wait(default 3s) and its per-level overrides (.process/.node/.rack): a wait set too short gives Spark less time to find a local slot before it falls back to a less-local one. - Check executor and data colocation: if the executors are running far from where the data actually lives (a different rack, a different zone), no amount of locality-wait tuning fixes a placement that isn't available to begin with.
Caching opportunity
CACHE
When the same DataFrame, RDD, or input is scanned more than once, low utilization can trace back to repeated recomputation rather than idle cores. Spark keeps nothing between actions: transformations only build a DAG, and once an action finishes its intermediate results are discarded[6]. Call a second action on the same logic and Spark re-runs the whole DAG from the source, which can mean re-reading a terabyte from S3, re-reading Kafka, or repeating expensive decompression[6:1]. Fork that logic into two pipeline branches and you sign up to recompute everything twice[6:2].
How it's detected
An input relation that recurs across at least 2 SQL executions in one run is flagged by its scan format and path identity. A join or union subtree that recurs across at least 2 executions is matched by operator name, metric names, and its join or filter condition normalized to strip per-analysis ids and canonicalize commutative operand order, while columns and literal values are kept intact: two executions of the exact same join or filter still match even when Spark's internal ids differ between runs, but a genuinely different filter or join value does not. A qualifying join or union subtree is reported as one finding covering everything beneath it. Every finding here reports at the info level.
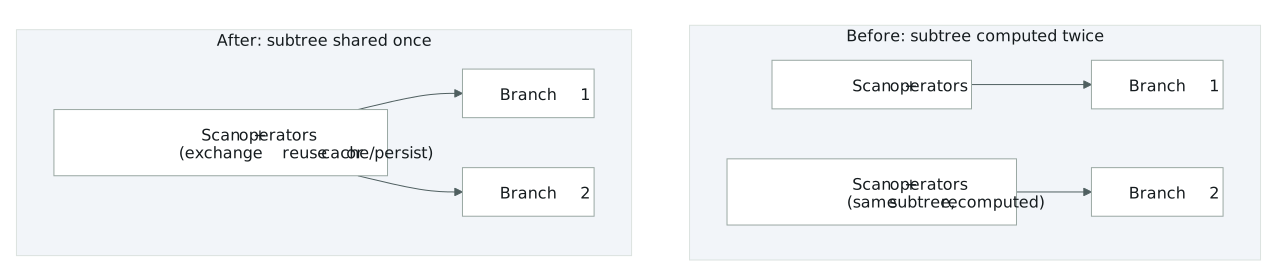
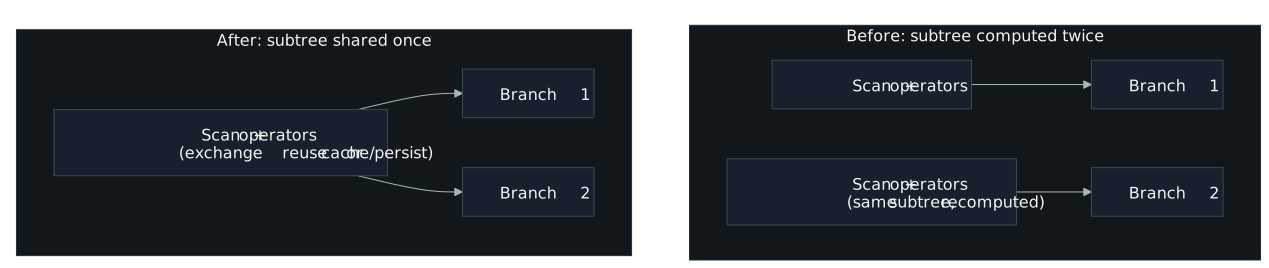
cache() and persist() are how you stop that. Persisting materializes the RDD (usually in memory on the executors) so it can be reused within the job, while Spark keeps its lineage to recompute any lost partition[7]. For a dataset you read repeatedly, this is one of the most useful optimizations available: it parks a DataFrame, table, or RDD in temporary storage across the executors and makes later reads fast[8]. Materialization is lazy and per-block, so only an action that touches every partition (count() or a full write) caches all of it; a subset scan like take(10) leaves a partial cache[6:3].
cache() is shorthand; persist() takes a StorageLevel and lets you pick the tradeoff:
| Level | Tradeoff |
|---|---|
MEMORY_ONLY | Fastest reads (deserialized JVM objects), but partitions that don't fit are recomputed on the fly each time[8:1]. |
MEMORY_AND_DISK | Spills the overflow to disk instead of recomputing; Spark's default caching strategy and fine for most pipelines[9]. For DataFrames, .cache() maps to this[6:4]. |
Serialized (_SER) | Byte arrays instead of raw objects: smaller footprint, slower reads. Reach for it when memory is tight[9:1]. |
Replicated (_2) | A second copy for fast fault recovery instead of waiting on recomputation, at twice the space[10][9:2]. |
Whether to spill to disk hinges on recomputation cost: reading a block back from disk only beats recomputing it when the work that produced the data is expensive or filters out a large fraction, so the RDD guide says don't enable disk otherwise[10:1].
Caching is not free, and several cases don't warrant it:
- Single use. Caching adds serialization, deserialization, and storage cost, so caching data you read once only slows you down[8:2].
- Data larger than storage memory, or a cheap transformation that isn't reused often regardless of size[11].
- Memory pressure. Cache memory is memory taken from processing, and under the default spill strategy cached data can land on slower disk, so caching can cost more than just re-reading the source[9:3].
- Lost optimizer freedom. Once a dataset is cached, Catalyst works on the in-memory copy and can no longer push filters down to the source[9:4].
A persisted RDD you've stopped using still occupies memory until the app ends or eviction forces it out, so call unpersist() to reclaim it deliberately, which matters most on shared clusters[9:5].
Related
- Task parallelism: Partitioning
- Executor sizing: Cluster Tuning
Learning Spark, 2nd Edition, Damji, Wenig, Das & Lee, ch. 7 ↩︎ ↩︎
High Performance Spark, 2nd Edition, Karau, Polak & Warren, ch. 8 ↩︎ ↩︎
Spark: The Definitive Guide, Chambers & Zaharia, ch. 19 ↩︎
High Performance Spark, 2nd Edition, Karau, Polak & Warren, ch. 2 ↩︎
Spark: The Definitive Guide, Chambers & Zaharia, ch. 19 ↩︎ ↩︎ ↩︎
Learning Spark, 2nd Edition, Damji, Wenig, Das & Lee, ch. 7 ↩︎