
Appearance
Cluster Tuning
Sizing executors and containers
Cluster tuning is the set of decisions that map an application's cores, memory, and executor count onto the underlying cluster (YARN or Kubernetes) plus a handful of related knobs (data locality, dynamic allocation, per-task CPU reservation) that all interact with that sizing decision.
The starting point is executor sizing. Working through a concrete example (a 10-node cluster with 16 cores and 64GB RAM per node), the derivation runs: assign 5 cores per executor; reserve about 1 core per node for Hadoop/YARN/OS daemons, leaving 15 usable cores per node (150 total); dividing by 5 cores per executor gives 30 executors, minus 1 reserved for the YARN ApplicationMaster (29); with 3 executors per node, memory per executor is 64GB / 3 ≈ 21GB, and after subtracting about 7% for YARN memory overhead that comes out to roughly 18GB usable, a recommended shape of 29 executors × 5 cores × 18GB[1]. Cloudera's own worked example, on a 6-node cluster with the same 16-core / 64GB-per-node hardware, lands on the same shape: --num-executors 17 --executor-cores 5 --executor-memory 19G, rather than one "fat" executor per node (--num-executors 6 --executor-cores 15 --executor-memory 63G)[2]. Both sources treat the resulting task count (executor-cores × num-executors) as the single most important tuning lever, since Spark cannot compensate for too little parallelism on its own[2:1]. spark.executor.cores is the config that controls concurrent tasks per executor; it defaults to 1 in YARN mode, or to all available cores on the worker in standalone mode[3], and spark.executor.memory sets the JVM heap size per executor[2:2]. Independent of the sizing formula above, the Spark tuning guide recommends targeting 2–3 tasks per CPU core across the cluster[4].
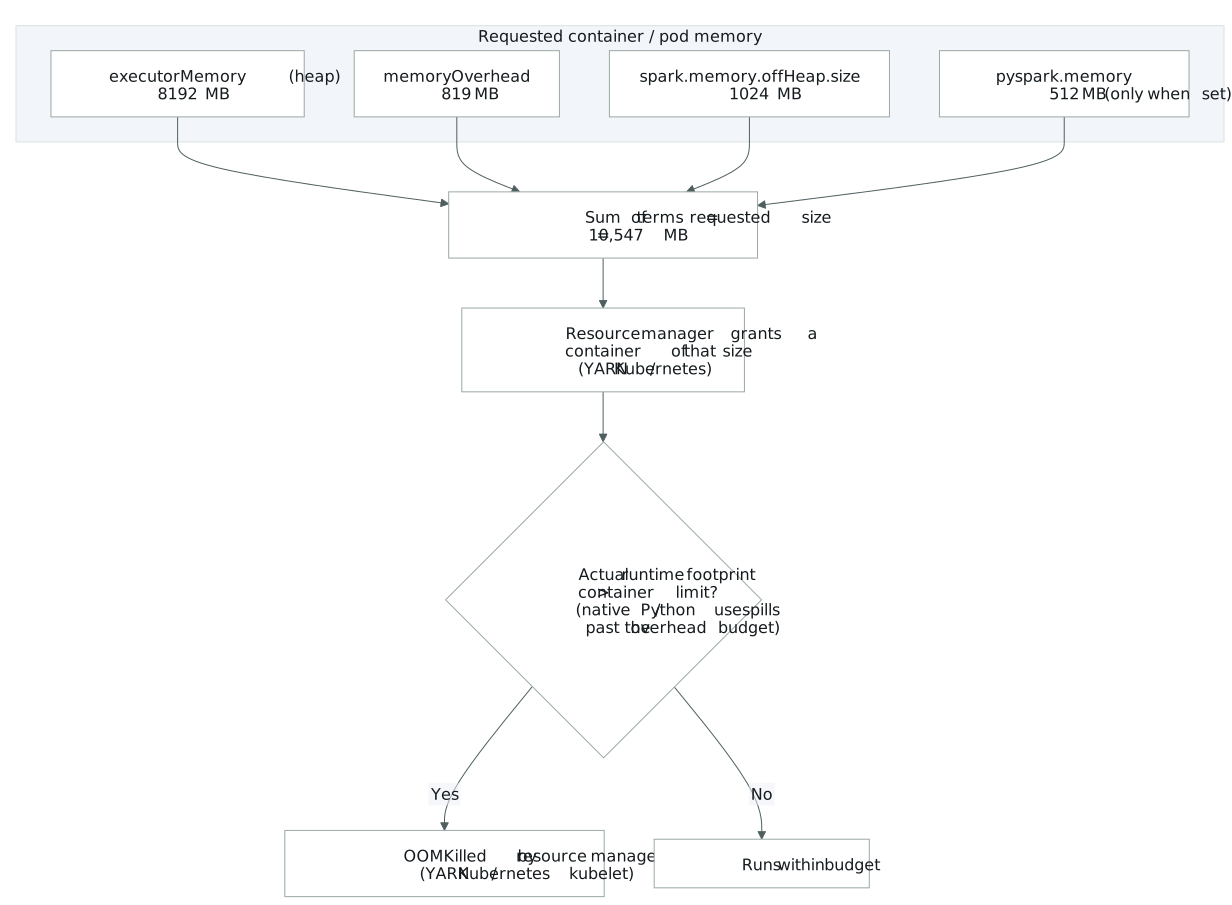
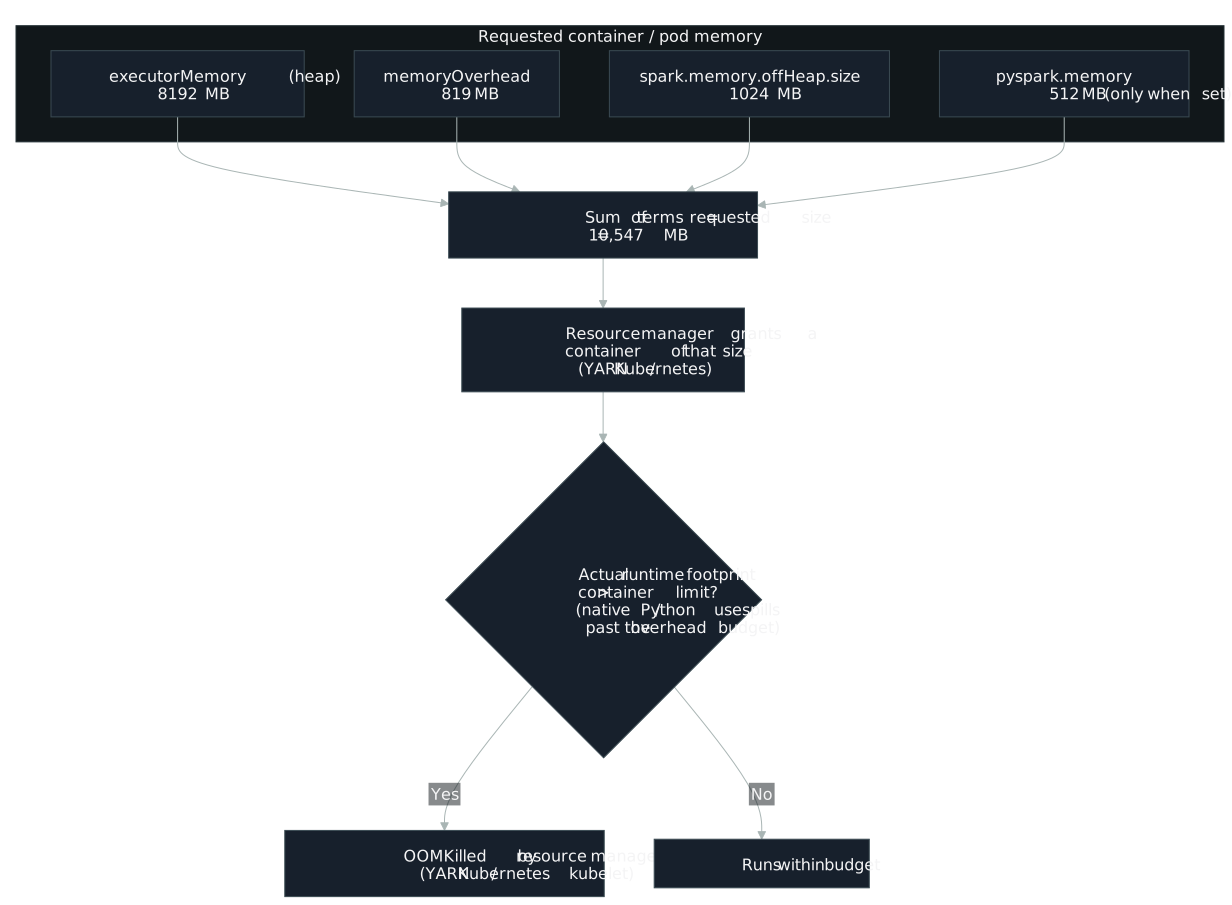
On top of executor memory sits container memory. Spark computes the total container/pod allocation as executorMemoryMiB + memoryOverheadMiB + memoryOffHeapMiB + pysparkMemToUseMiB. On YARN this is what gets allocated for the container, on Kubernetes it becomes the pod memory limit[5]. spark.executor.memoryOverhead itself defaults to max(0.1 * executorMemory, 384MB)[5:1][3:1].
PySpark:
spark.executor.pyspark.memoryis only added as its own container-memory term when it's set explicitly; otherwise PySpark's memory use is folded into the general overhead budget rather than tracked separately.[5:2]
On Kubernetes specifically, spark.kubernetes.executor.request.cores and spark.kubernetes.executor.limit.cores take priority over spark.executor.cores for the pod's CPU request/limit sent to the Kubernetes scheduler[6], while spark.executor.cores remains the config Spark itself uses to size the number of concurrent task slots[3:2].
Two more knobs round out the picture. spark.locality.wait (default 3s) controls how long a task waits for a data-local placement before Spark gives up and schedules it less locally, stepping through the same wait across process-local → node-local → rack-local → any; each level can be overridden independently via spark.locality.wait.process, .node, and .rack, all of which default to the base wait when left unset[3:3]. Dynamic allocation lets Spark add and remove executors as work changes, but it requires one of several supporting mechanisms: an external shuffle service, shuffle tracking (spark.dynamicAllocation.shuffleTracking.enabled, default true since Spark 3.0), shuffle-block decommission, or the experimental sort-IO plugin[3:4]. Removing an executor can otherwise destroy shuffle state it's holding. Finally, spark.task.cpus (default 1) sets how many cores each task reserves; the number of concurrent task slots per executor is derived jointly from it and spark.executor.cores, roughly spark.executor.cores / spark.task.cpus[3:5].
Spotting a bad sizing decision
Getting that sizing wrong shows up in a handful of specific symptoms. The clearest sign of an under-sized executor layout is HDFS throughput dropping under load: "HDFS client has trouble with tons of concurrent threads. It was observed that HDFS achieves full write throughput with ~5 tasks per executor"[1:1]. The "fat executor" case (one executor per node, using all 16 cores) shows the failure mode directly: "with all 16 cores per executor... HDFS throughput will hurt and it'll result in excessive garbage [collection]"[1:2].
On the memory side, an executor or pod that dies with no Spark-level error is a strong signal that off-heap memory was never added into the container budget. Enabling spark.memory.offHeap.enabled=true with spark.memory.offHeap.size=1g on top of an 8G executor with default overhead (819MB) means real usage is 8192+819+1024 = 10,035MB, while the container was only granted 8192+819 = 9,011MB. The executor gets killed by YARN, or OOMKilled by the Kubernetes kubelet, with no warning from Spark itself[5:3].
With dynamic allocation on, unexplained shuffle recomputation is a detectable symptom of executors being reclaimed mid-shuffle: "In the event of stragglers... dynamic allocation may remove an executor before the shuffle completes, in which case the shuffle files written by that executor must be recomputed unnecessarily"[6:1]. Jobs that abort with a serialized-result-size error are hitting the spark.driver.maxResultSize guardrail rather than a driver heap exhaustion: "Jobs will be aborted if the total size [of serialized action results] is above this limit"[3:6]. And on the resource-waste side, executors that are provisioned but never assigned work are a sign that dynamic allocation is targeting full parallelism against a workload made of many small tasks[3:7].
What a bad sizing decision costs
Each symptom above carries a specific price tag. Task count (executor-cores × num-executors) is treated by both cited sources as the single most important tuning lever, since Spark cannot compensate for too little parallelism on its own[2:3]. Going the other way, cramming too many cores into one executor degrades HDFS throughput and drives up garbage collection[1:3].
Container-memory misconfiguration matters because the failure is silent from Spark's point of view: off-heap memory that isn't accounted for in spark.executor.memoryOverhead causes the executor to actually use more memory than the container/pod was granted, so it gets killed externally (by YARN or the kubelet) with no Spark-level diagnostic to point at the real cause[5:4].
Dynamic allocation's interaction with shuffle state matters because, before dynamic allocation existed, an executor exiting alongside its application meant all its state could be safely discarded; with dynamic allocation, the application keeps running after an executor is explicitly removed, so any later need for that executor's state forces a recompute[6:2]. That is exactly why Spark needs "a mechanism to decommission an executor gracefully by preserving its state before removing it"[6:3]. Without shuffle tracking, an external shuffle service, or shuffle-block decommission enabled, dynamic allocation either can't be turned on at all, or, if it's active regardless, an executor holding unpreserved shuffle output that gets removed forces exactly that unnecessary recompute[3:8][6:4].
On the driver side, spark.driver.maxResultSize and spark.driver.memory are separate budgets that still interact: whether a high maxResultSize actually causes an out-of-memory error "depends on spark.driver.memory and memory overhead of objects in JVM"[3:9]. Raising one without considering the other doesn't fully protect the driver.
Finally, over-provisioning executors against a small-task workload wastes cluster resources: "with small tasks this setting can waste a lot of resources due to executor allocation overhead, as some executor might not even do any work"[3:10].
Sizing the cluster correctly
Avoiding those costs starts from a formula, not one fat executor per node. Apply the balanced-executor formula instead; the worked examples above give shapes like 29 × 5 × 18GB for a 10-node/16-core/64GB cluster, or 17 × 5 × 19G for a 6-node cluster with the same per-node hardware[1:4][2:4]. Keep --executor-cores at or below roughly 5 so HDFS client concurrency stays in the range where it sustains full write throughput[1:5].
When enabling off-heap memory, account for spark.memory.offHeap.size in the container/pod memory budget explicitly; spark.executor.memoryOverhead's default of max(0.1 * executorMemory, 384MB) does not include it[5:5]. If you're still referencing the older spark.yarn.executor.memoryOverhead name, note it was removed in Spark 3.0[5:6].
On Kubernetes, remember that spark.kubernetes.executor.request.cores and .limit.cores govern the pod's CPU request/limit and take priority over spark.executor.cores for that purpose[6:5], while spark.executor.cores separately governs Spark's own task-slot count[3:11]. The two need to be reasoned about together rather than assumed to be redundant.
Tune spark.locality.wait (and its per-level overrides) upward when tasks are long-running and locality is poor, since the default is tuned for typical workloads[3:12]; set spark.locality.wait.node to 0 to skip straight to rack locality when node locality isn't achievable[3:13].
Turn on shuffle tracking (spark.dynamicAllocation.shuffleTracking.enabled, default true since Spark 3.0) or the external shuffle service so dynamic allocation can reclaim executors without losing shuffle output or forcing recomputation[3:14][6:6]. The external shuffle service additionally lets persisted RDD blocks survive executor removal when spark.shuffle.service.fetch.rdd.enabled is set, and executors holding cached blocks are, by default, never removed at all, tunable via spark.dynamicAllocation.cachedExecutorIdleTimeout[6:7].
Set spark.driver.maxResultSize as a guardrail on serialized action-result size, and size spark.driver.memory with it in mind rather than in isolation[3:15]. Use spark.dynamicAllocation.executorAllocationRatio (default 1.0, added in 2.4.0) to scale down over-allocation when tasks are small; for example, a value of 0.5 halves the target executor count dynamic allocation would otherwise compute[3:16]. Raise spark.task.cpus above its default of 1 when a task needs more than one core; doing so proportionally reduces concurrent task slots per executor (spark.executor.cores / spark.task.cpus)[3:17].
Autoscaling churn
CHRN EXPERIMENTAL
Dynamic allocation adds executors once tasks back up and frees them once they go idle[6:8]. Churn is a narrower failure mode inside that same mechanism: executors that get stood up and torn down again before they've done much useful work, cycling through provisioning and JVM startup cost repeatedly instead of running tasks.
How it's detected
An executor counts as short-lived when its lifetime, from its ExecutorAdded event to either its ExecutorRemoved event or the end of the run if it was never removed, is under 2 minutes. This is evaluated once a run has added at least 5 executors, a floor that keeps a two- or three-executor job from registering on ordinary scale-down.
| Signal | Warning | Critical |
|---|---|---|
| Share of added executors that are short-lived (< 2 min lifetime) | > 30% | > 60% |
The 2-minute lifetime cutoff and the 30%/60% split are unvalidated heuristics rather than figures published in Spark's own documentation or benchmarks, so treat a finding here as a prompt to look at the executor timeline rather than a calibrated verdict.
Why it matters
Every short-lived executor pays the same provisioning and JVM-startup cost as a long-lived one, but returns little task work in exchange. A run that keeps flapping between scaling up and down spends more of its wall-clock time paying that repeated overhead than one that settles into a stable executor count.
How to fix it
- Raise
spark.dynamicAllocation.executorIdleTimeout(default 60s[3:18]) so an executor survives a brief lull instead of being released the moment it goes idle, only to be requested again shortly after. - Widen the gap between
spark.dynamicAllocation.minExecutorsand.maxExecutors[3:19]: bounds set too close together force Spark to repeatedly add and remove executors to track small fluctuations in the task backlog instead of settling into a stable range.