
Appearance
Memory / Disk Spill
SPILL
What it is
Spill happens when a task's share of execution memory runs out during a sort or hash aggregation. Each task gets its own TaskMemoryManager, which arbitrates the shared execution pool across every task running concurrently on an executor; with n tasks running concurrently, each is allowed to allocate somewhere between 1/(2n) and 1/n of total execution memory: a soft limit, not a hard stop.[1] When a task's sort or hash-aggregation operator keeps requesting execution-memory pages it can't get, Spark doesn't fail immediately: it blocks the requesting task, triggers a spill of that task's in-memory data structure to disk, or, in the worst case, throws an OutOfMemoryError.[1:1]
The spill path runs through Spark's map/shuffle I/O machinery: shuffle partitions created by wide transformations like groupBy() or join() spill to the executors' local disks, at the location set by spark.local.directory.[2] SQL physical operators apply the same idea with their own guardrails: SortMergeJoinExec's in-memory buffer and the cartesian-product operator's buffer both spill once they cross a configured row-count threshold, which by default is spark.shuffle.spill.numElementsForceSpillThreshold.[3] Whatever the trigger, the resulting spilled bytes are exposed on the task metrics as memoryBytesSpilled, visible in the Spark UI and event log.[4]
How it's detected
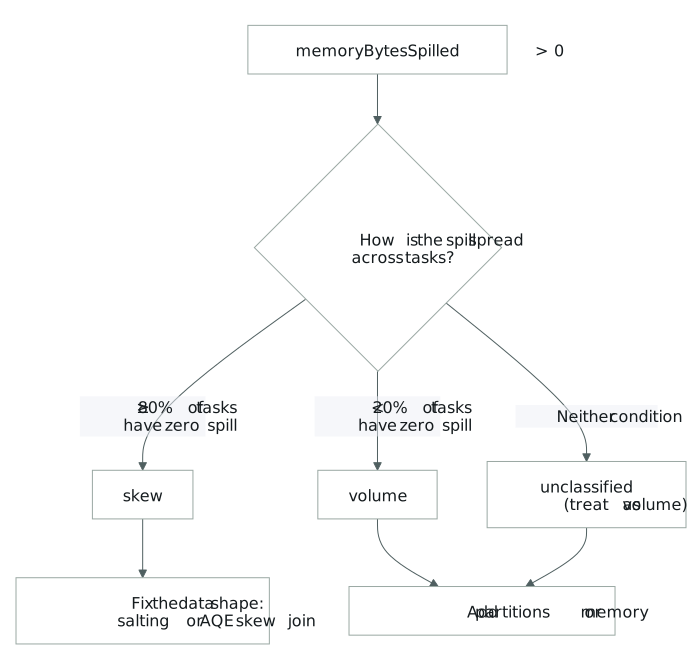
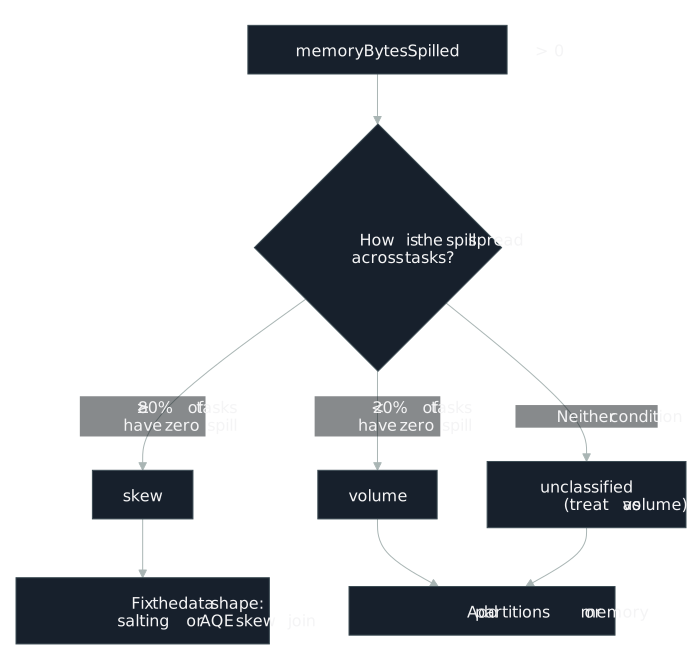
Detection: any memoryBytesSpilled > 0 → Warning. The classification is the actionable signal.
Spill classification:
skew: ≥ 80% of tasks have zero spill; fix: address task skew, not memory.volume: < 20% of tasks have zero spill; fix: more partitions or more memory.unclassified: neither condition; treat as volume.
Why it matters
Spill is the fallback Spark reaches for once a task can no longer get the execution memory it's asking for: rather than failing outright, it blocks the task, writes its buffered data to disk, or (if that's not enough) throws an OutOfMemoryError.[1:2] A task that's spilling has already given up pure in-memory speed to keep running at all, which is why the skew-vs-volume split above is the actionable part of the signal: the two failure shapes call for opposite fixes.
How to fix it
- Skew: When only a few tasks spill, the problem is the shape of the data, not the size of the memory pool.
repartition()is the tool for this: reach for it specifically to fix a lopsided partition distribution or to increase partition count[5], in contrast tocoalesce(), which never rebalances skewed data because it just stacks existing partitions together: partitions that were uneven going in are still uneven coming out.[6] For skewed joins, Adaptive Query Execution can detect and split[7] oversized partitions automatically: a partition counts as skewed once it's larger thanspark.sql.adaptive.skewJoin.skewedPartitionFactor(default5.0) times the median partition size, and also larger thanspark.sql.adaptive.skewJoin.skewedPartitionThresholdInBytes(default256 MB).[8][9] Before AQE existed, the manual equivalent was salting: adding a prefix to the skewed keys to make the same key look different, then adjusting the data distribution accordingly.[7:1] Databricks'/*+ SKEW(...) */hint lets you name the skewed relation and specific key values directly, so the planner targets just those keys instead of relying on automatic detection.[10] - Volume: When most tasks spill, the fix is more room to work with: more partitions, more memory, or both.
repartition(n)guarantees exactlynoutput partitions via a hash shuffle[11], and since Spark's per-task startup overhead is low (unlike MapReduce's), the general bias is to err toward more partitions rather than fewer.[12]spark.sql.files.maxPartitionBytes(default128 MB) is the equivalent lever on the input side, governing how much file data gets packed into each input partition before a shuffle even happens.[6:1] On the memory side, execution memory is a fraction of the JVM heap.spark.memory.fraction(default0.6) sizes the shared execution/storage region as(JVM heap − 300 MiB) × spark.memory.fraction[13]. Because each task's slice of that region is capped by theTaskMemoryManagerat between1/(2n)and1/nof the total,[1:3] giving executors more memory, or running fewer concurrent tasks on each one, directly raises the ceiling before spill kicks in.
For the volume case, give tasks more room: defaults shown, comments say which way to move:
properties
# Create more, smaller input partitions before the shuffle (default 128m)
spark.sql.files.maxPartitionBytes=128m

# Execution/storage share of (JVM heap - 300MiB) (default 0.6);
# raising it grows execution memory but starves the untracked user-memory region
spark.memory.fraction=0.6
For the skew case (only a few tasks spill), the fix is df.repartition(n), not more memory: see Partitioning.
Confidence
The core detection (any memoryBytesSpilled > 0) and the skew-vs-volume classification are validated: both the skew branch (most tasks spill nothing, so the shape of the data is the problem) and the volume branch (nearly every task spills, so the pool is too small) map to a well-understood fix, and neither needs further validation. EXPERIMENTAL When a spill matches neither shape, it falls back to a low-confidence unclassified finding that still requires validation, because there is no confirmed cause to act on; the page defaults it to the volume remedy, but that is a guess, not a diagnosis.
Limitations / false-positive risk
Some spill is normal. A large aggregation or join can spill by design once its working set outgrows execution memory, and a small spill on a healthy stage rarely repays the effort of chasing it. The raw memoryBytesSpilled > 0 trigger fires on both the actionable and the routine cases, so treat a small spill as informational until the skew-vs-volume split says otherwise.
Related
- Why it happens: Memory Management, Partitioning
Learning Spark, 2nd Edition, Damji, Wenig, Das, Lee, ch. 7 ↩︎
Spark: The Definitive Guide, Chambers & Zaharia, ch. 19 ↩︎
SPARK-29544: Optimize Skewed Join in SQL Adaptive Execution ↩︎ ↩︎
Performance Tuning (Spark SQL, DataFrames and Datasets Guide) ↩︎
How to Tune Your Apache Spark Jobs (Part 2): Cloudera Engineering Blog ↩︎